

1
Select the region
Select the region where logs will be stored.
Logging may be unavailable in some regions. Select the region that is geographically closest to the equipment.
2
Create a namespace
In the Cloud menu, navigate to Managed Logging and click Set up Managed Logging. A “Create namespace” dialog appears.
Enter the namespace name according to the following restrictions: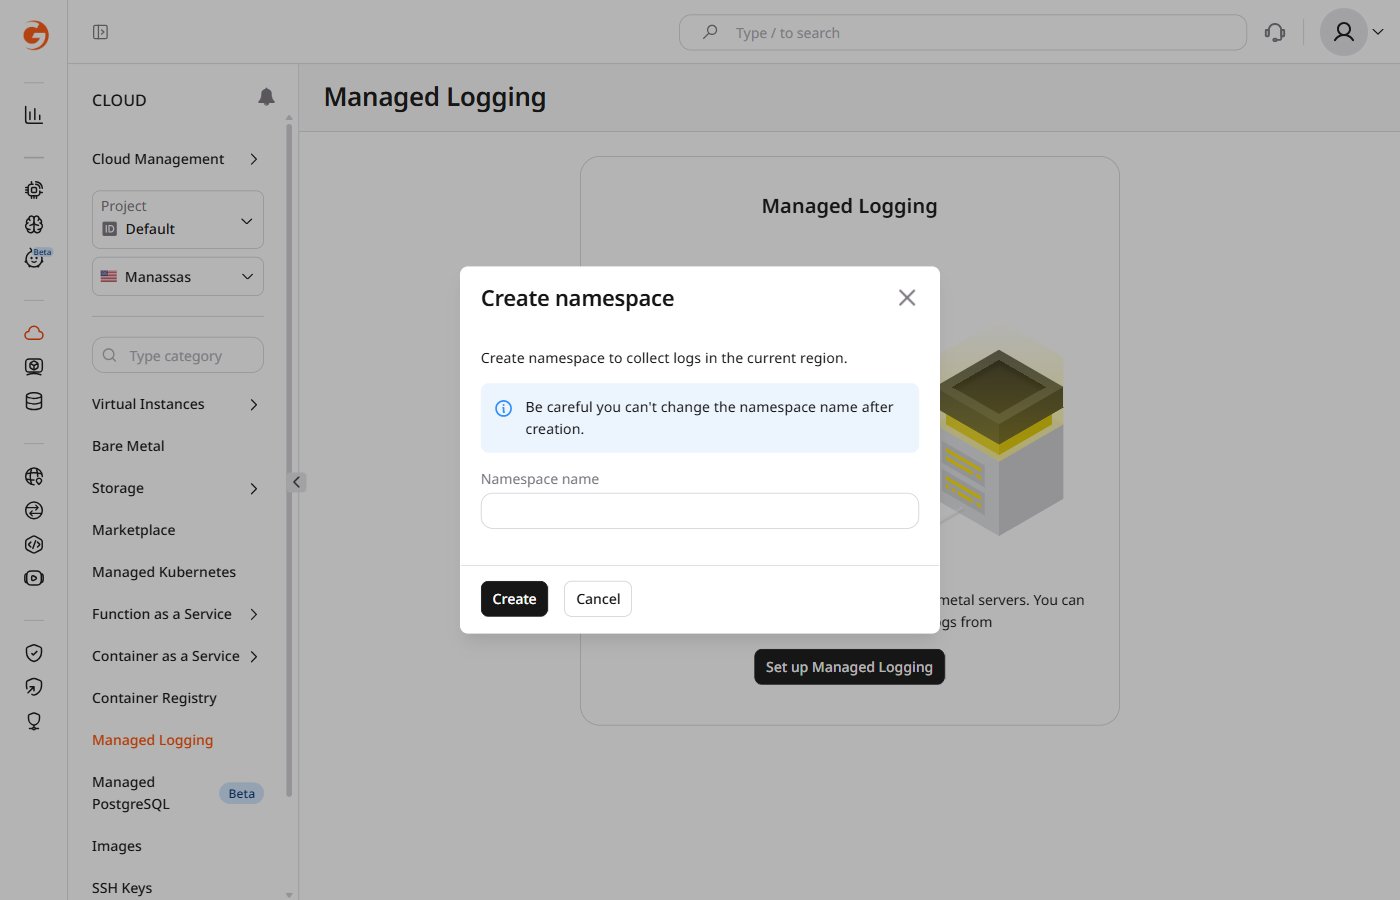
What is a namespace
What is a namespace
A namespace is a prefix applied to all topic names in the region. Previously, Managed Logging automatically generated a non-human-readable namespace string (e.g.,
cbc25c71af8d4f7ca6cbbcdc5a4d68fe). Human-readable namespaces are now supported (e.g., namespace123), which produces topic names in the format namespace123.topic-name.A human-readable namespace can only be created for a new project that does not already have a default namespace assigned. Once created, the namespace name cannot be changed.
- Lowercase Latin letters and digits can be used
- Underscores and spaces are prohibited
- Length is between 2–32 characters
- The name must be unique for the destination region. If it is already used, the system will suggest a different name.
3
Create a topic
In the Topics section, click Create topic, enter a name, set the retention period, and click Save. Gcore automatically creates an index pattern for the topic in OpenSearch Dashboards using “@timestamp” as the time field.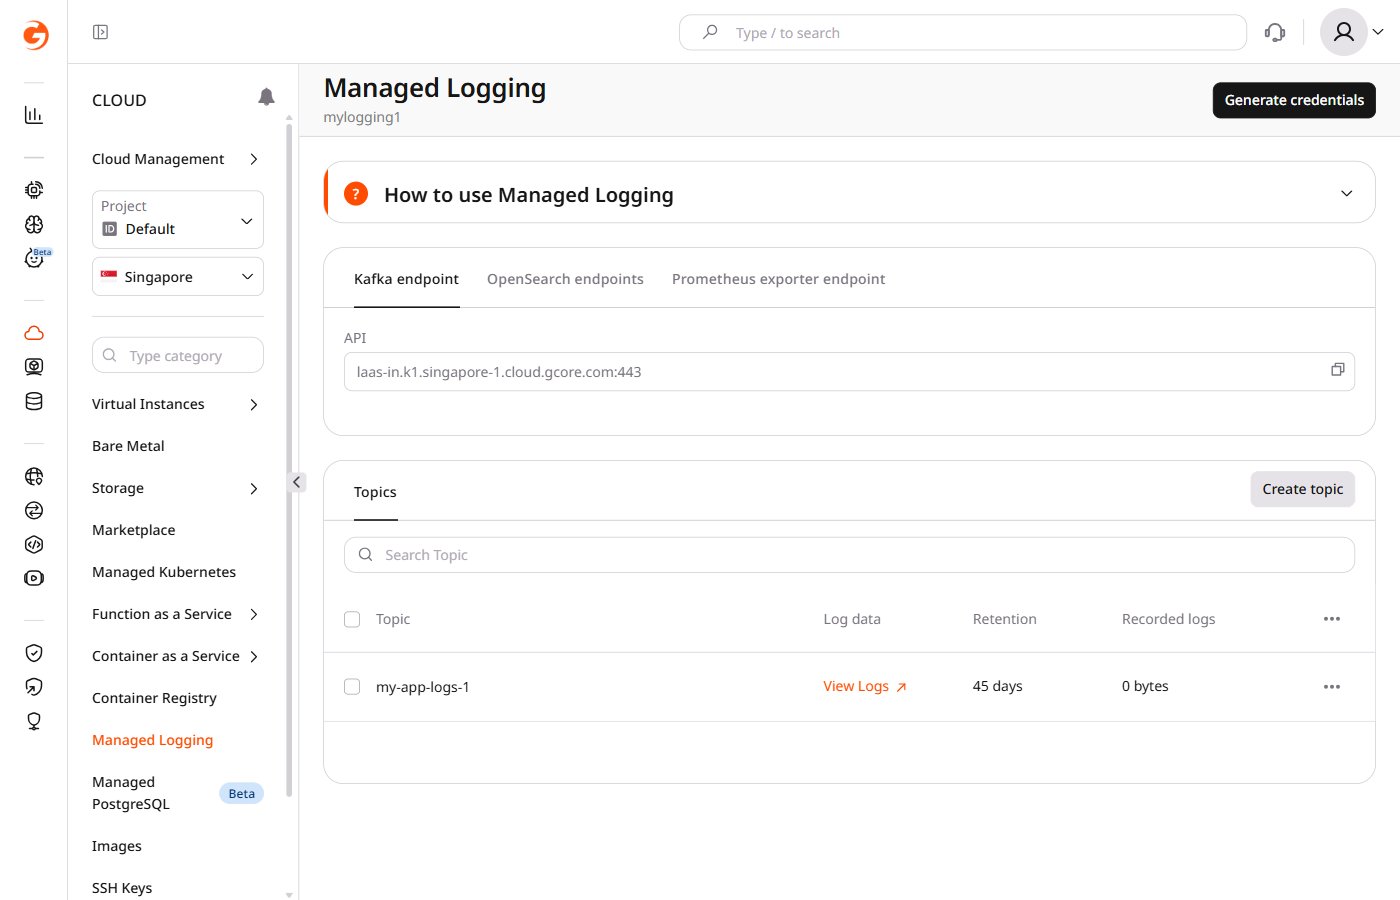
4
Generate credentials
Click Generate credentials in the upper-right corner. A warning dialog appears — click Confirm to proceed. A “Credentials” dialog shows a login (the namespace name) and password for the storage. Save the credentials immediately — they cannot be retrieved after closing the window.Use these credentials to authenticate log shippers that send logs to Managed Logging.If the credentials are lost, click Generate credentials again to generate a new pair. The previous credentials are deactivated automatically. Update the credentials in the settings of the installed log shippers.If Managed Logging is used in multiple regions, each region has separate storage and requires its own credentials.
5
Configure a log shipper
Select a log shipper (e.g. Fluent Bit, Filebeat, or Logstash) that supports Kafka output.Configure the log shipper with the Kafka endpoint, credentials generated in step 4, and target topic name The pre-created index pattern uses “@timestamp” as the time field. If the log shipper sends a field named
<namespace>.<topic>. To find the Kafka endpoint, navigate to the Logging page and open the Kafka endpoint tab in the How to use Managed Logging section.Log message size is max 1 MB in text/JSON format, limited to 225 fields. After the log shipper is configured, logs flow automatically from the device to the Kafka topic, and then to OpenSearch for indexing.
@timestamp in each log record — which most shippers do by default — no additional configuration is required in OpenSearch. If the logs use a different field name for the timestamp, a custom index pattern must be created after signing in to OpenSearch Dashboards.6
Open OpenSearch Dashboards
Navigate to OpenSearch Dashboards using the URL from the Dashboards field under the OpenSearch endpoints tab on the Logging page.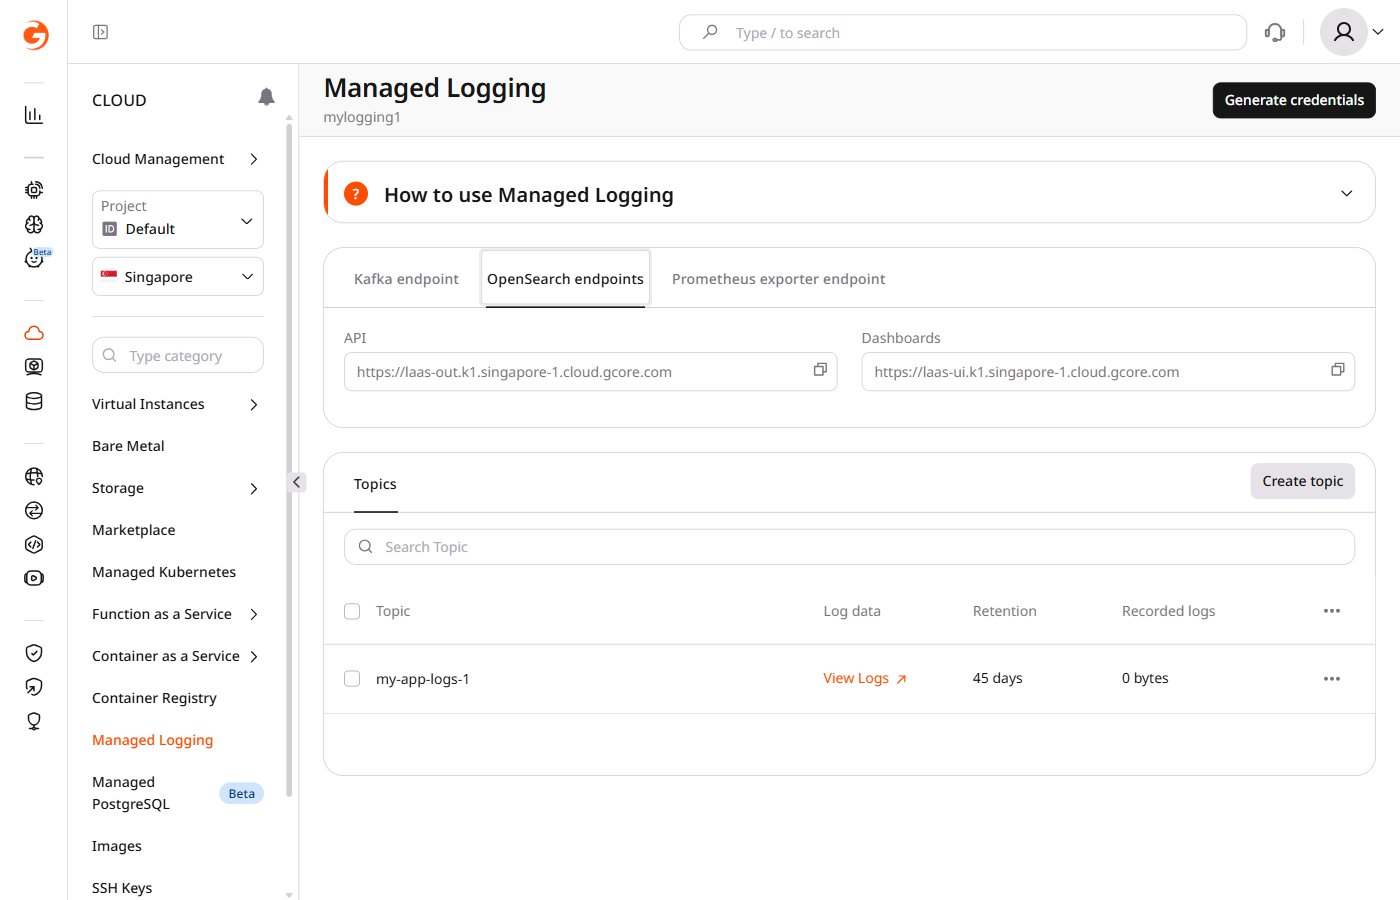
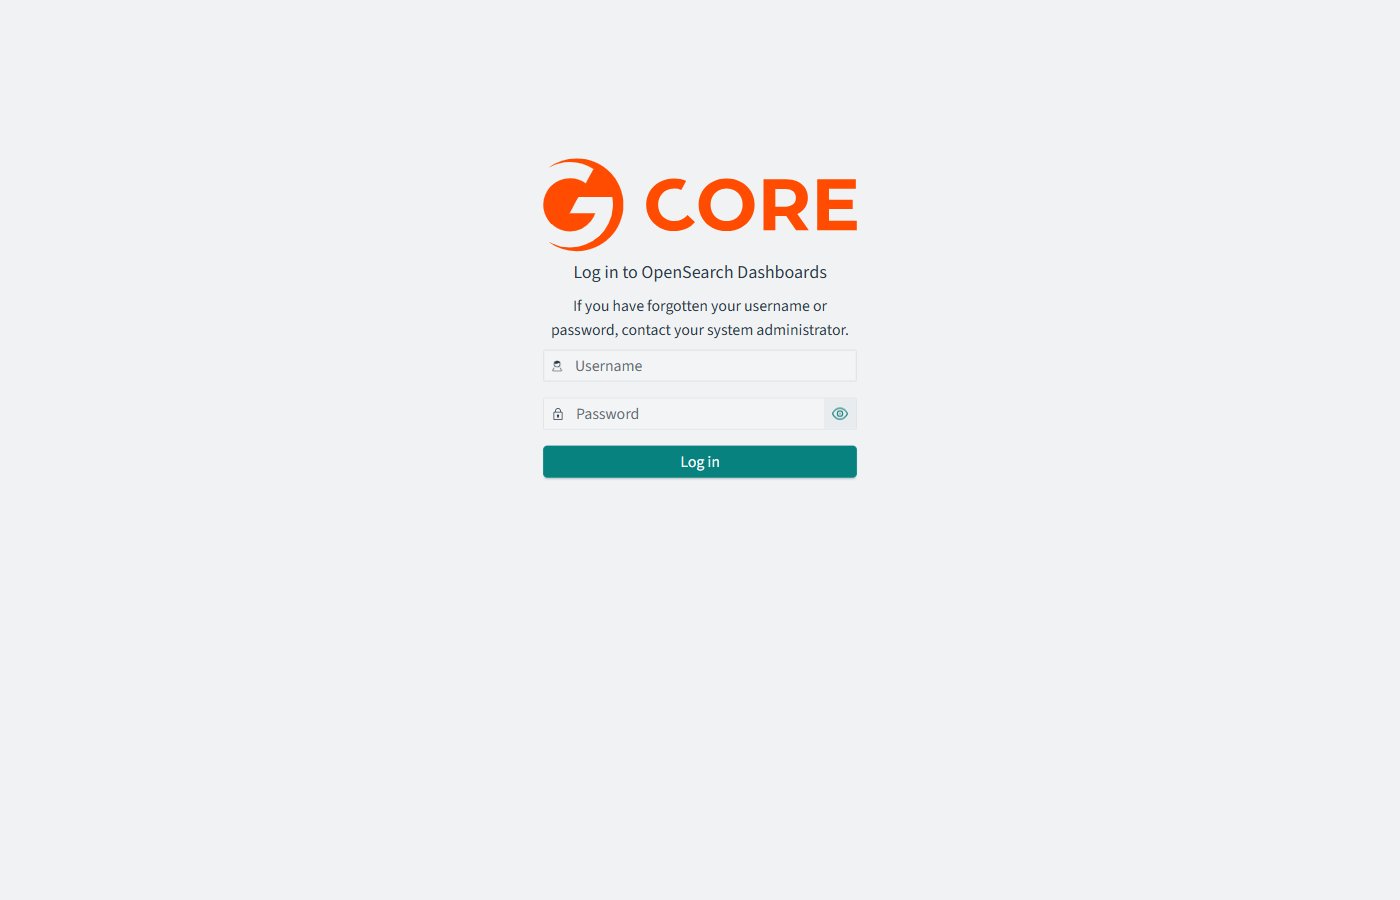
On first login, a dialog prompting tenant selection appears. Select Private and click Confirm to proceed.
Create a custom index pattern
Create a custom index pattern
Navigate to Index patterns. Click Manage in the upper-right corner of the home page, then select Index patterns from the left menu.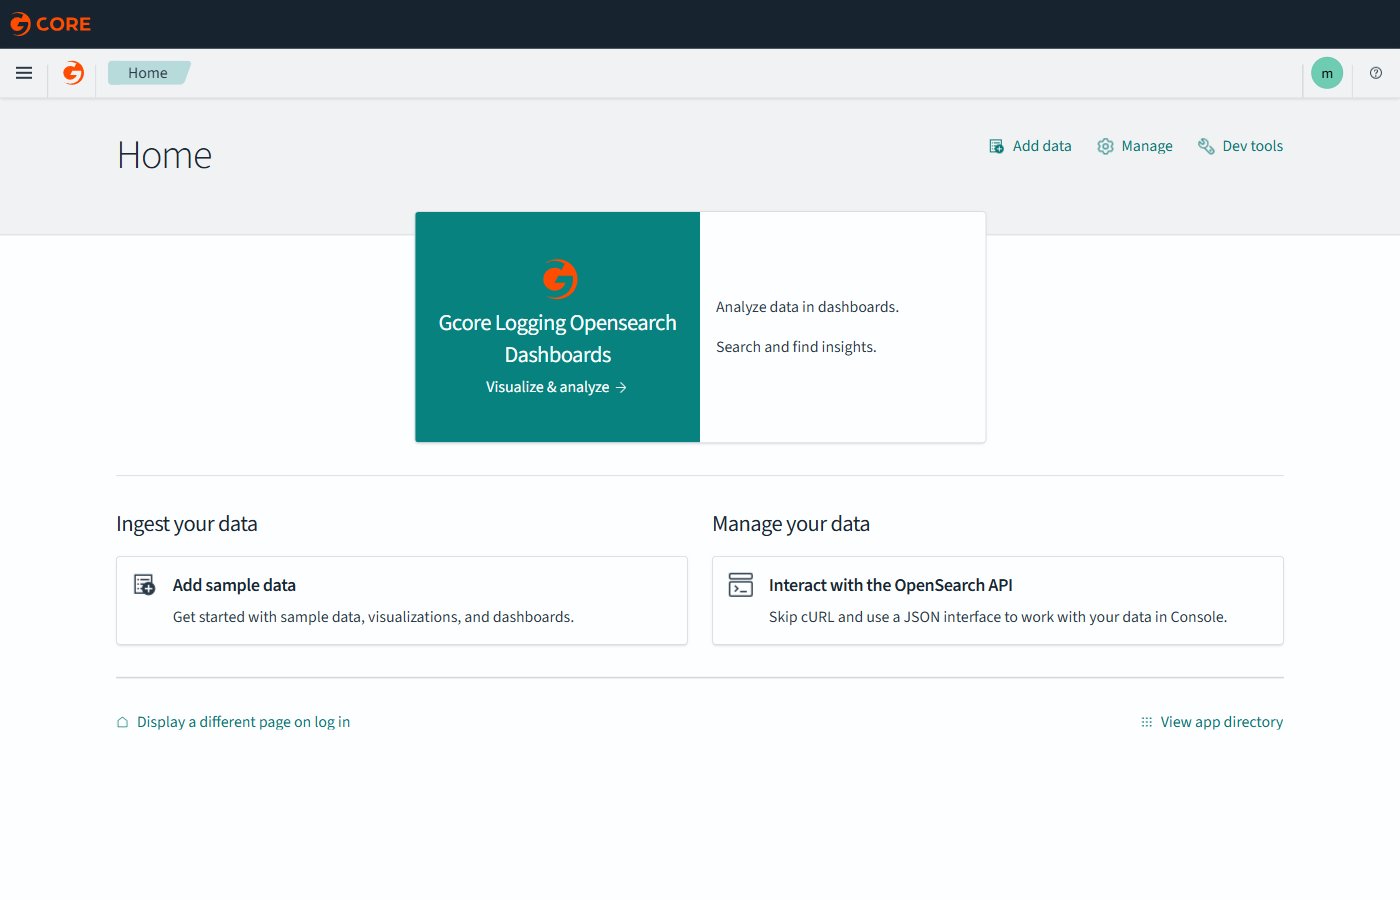
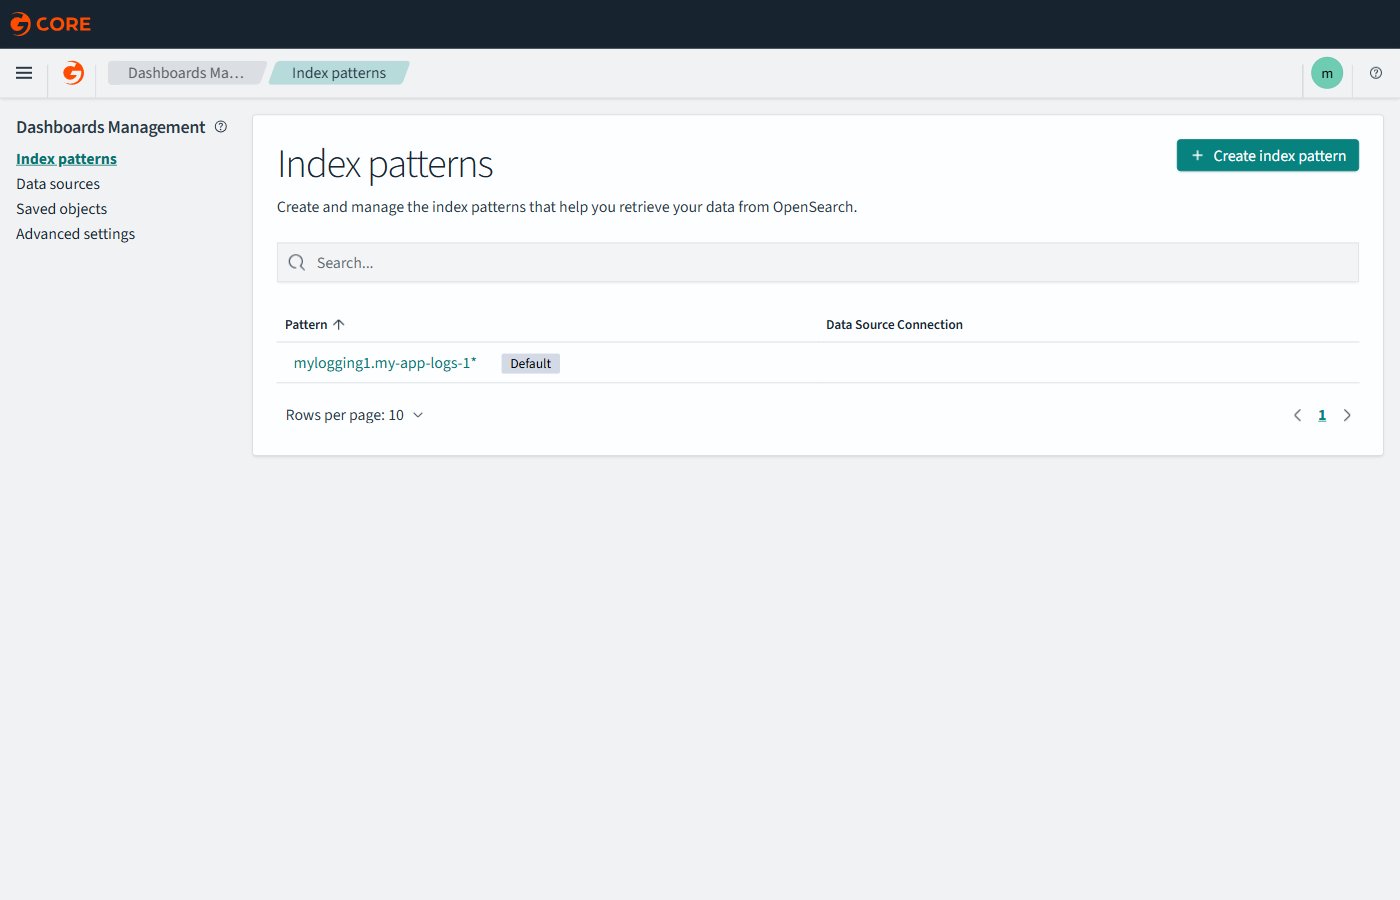
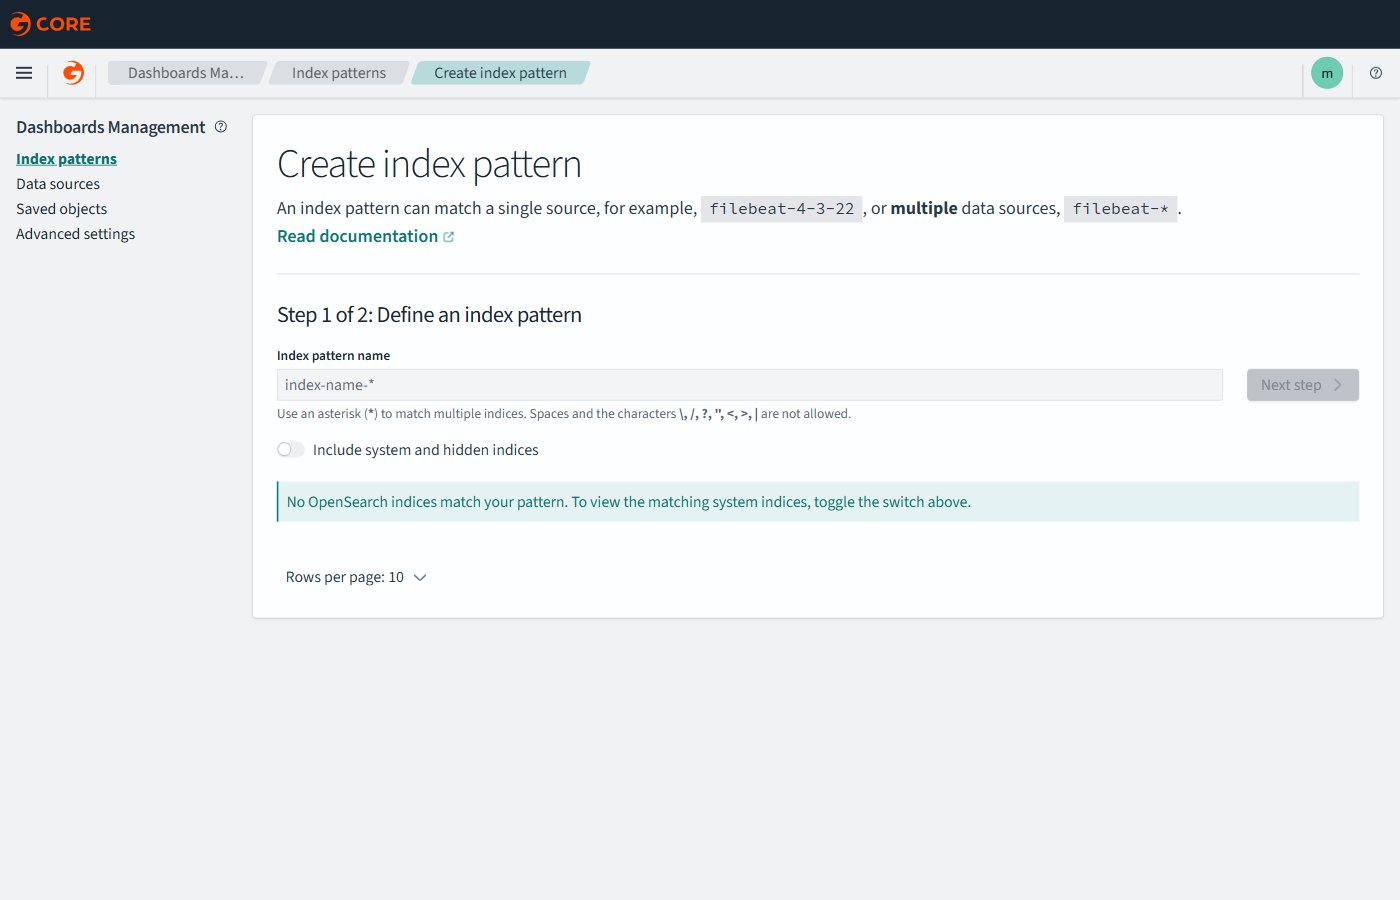
mylogging1 and the topic is my-app-logs-1, enter mylogging1.my-app-logs-1*. Click Next step to proceed.7
View logs
To view logs, navigate to the main menu and select Discover.